
June 2026 Market Update

The June FOMC meeting was the first meeting for new Federal Reserve Chairman, Kevin Warsh. The Committee decided to leave interest rates unchanged at 3.50%-3.75%. Warsh immediately began making changes to the way the Federal Reserve communicates by drastically shortening the FOMC statement, removing forward guidance, and refusing to provide an outlook via the dot plot. The statement was short and concise, six to seven sentences and ended by reading, “The Committee will deliver price stability.”
Federal Funds Rate vs 2 Year Yield

Since November 2025, reserve balances have remained stable, but the size of the Fed balance sheet has grown from approximately 6.5 trillion to 6.7 trillion, and during this time inflation has risen from 2.6% in November 2025 to 4.2% in May of 2026. The financial system continues to be extremely dependent on the small asset purchase program (QE) the Fed initiated at the December 2025 FOMC meeting. Contrary to new Fed Chair, Kevin Warsh’s desire, the small asset purchase program will need to grow much larger in the months ahead to support a deteriorating consumer economy and the stock market, which has exacerbated inflation and affordability conditions consumers are experiencing.
Fed Balance Sheet & Reserves Balances vs Consumer Price Index

New Fed Chair Warsh wants to shrink the size of the Fed’s balance sheet, increase consumer purchasing power, and close the wealth gap by reducing inflation and delivering price stability. If effective this would put an end to the currency debasement trade which has dominated the financial system for the past handful of years. Warsh is signaling to the market that he will do just that, and so far, the market is taking Warsh at his word. The prices of gold and bitcoin have struggled since Warsh was nominated by Trump in late January. The market has shifted from pricing in interest cuts to pricing in two to three interest rate hikes by the end of 2026.
Warsh stated he wants the Fed to get out of the projection business and stick to a rules-based method of conducting monetary policy. The Taylor Rule, which is a formula which incorporates the unemployment rate, GDP, and the inflation rate to compute what level interest rates should be, currently suggest interest rates should range between 4.8%-6.3%. The Fed is currently at 3.50%-3.75%, a full point below the most conservative Taylor Rule estimate.
Taylor Rule Estimates

The change in communication from the Fed, and the market shifting to expect the Fed to raise interest rates this year may help tame inflation expectations, so the Fed does not end up having to raise rates. The issue Warsh is going to have is the Trump administration is operating the economy with an elevated level of spending, debt, and deficits. The government’s subsidization of Ai has created inflation and helped twenty or so large technology companies lead the stock market higher, but has hurt the real economy and consumer with affordability issues.
Running the economy hot to inflate the government’s way out of debt typically results in shrinking of the middle class and causes consumers to pullback on consumption, which usually requires higher debt and deficits to stimulate the economy. A sort of conundrum.
This conundrum of high debt and deficit spending is hurtful to the real economy and consumer, and may force new Fed Chair Warsh to abandon his plans of shrinking the Fed’s balance sheet, increasing purchasing power, reducing inflation, and providing price stability.
We believe the market will shift away from its belief that the Fed will raise interest rates two to three times this year and shift toward the Fed cutting interest rates at least once before the end of 2026. This would cause the debasement trade to come back, and it would likely help prices of gold and bitcoin rise, if/when this shift in interest rate outlook occurs.
Short term interest rates may decline, but the only way longer term interest rates and mortgage rates are going to substantially decline is with a strong economic downturn and/or recession, combined with fiscal discipline. Given the current level of housing unaffordability, if a recession were to begin tomorrow and government quickly responds by printing money to stimulate the economy the day after, the cost to build housing and mortgage rates would likely rise, and the American economy would struggle to grow its way out of an economic downturn.
The U.S. economy and American households have become more dependent on the stock market than ever before. The government will do whatever it takes to keep asset prices such as real estate and stocks up, even if that means ruining the purchasing power of the wages working Americans earn. Investment Advisers and Stock Index Managers have in a strange way become government employees under this new paradigm, which is a major reason gold has outperformed stocks over the past twenty years.
Household and Nonprofit Organizations Held Corporate Equities as a Percentage of Financial Assets

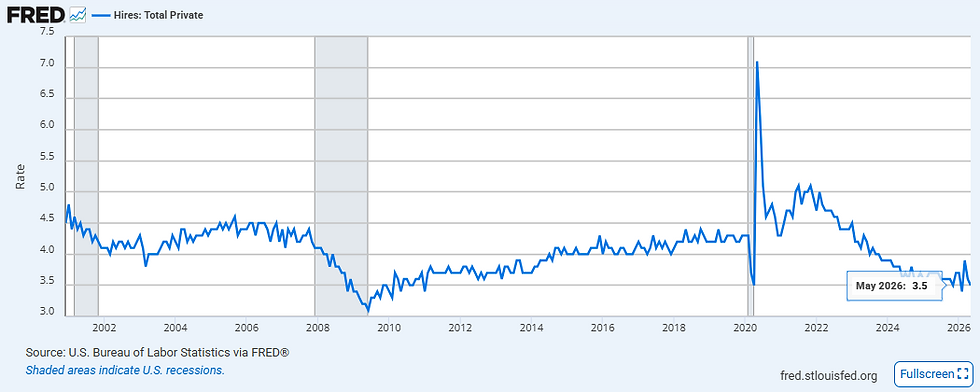
Below is a look at some important economic data relevant to an appropriate level of interest rates:
Inflation Rate - Consumer Price Index

Hiring Rate
Construction Hiring Rate

Newly Constructed Completed Homes for Sale

U.S. Personal Savings rate

Real Personal Disposable Income

U.S. Real Personal Income Growth Rate

U.S. Real Wage Growth

Real Average Hourly Earnings Growth

American households are getting squeezed with rising costs for energy, housing, and healthcare. The U.S. savings rate was 3% in May, the real personal income growth rate is still in negative territory (-0.43%). Real disposable income growth is 0.01%, and real average hourly earnings growth is (-0.72%). Since 1960, there have only been ten periods where the real personal income growth rate fell into negative territory, eight out of ten of those periods coincided with an economic recession.
The following charts are important to consider for investors choosing an asset allocation mix. Investing in the S&P 500 at a price to earnings ratio of twenty-two times or greater has historically led to a negative 10-year return. The valuation at which an investor enters the stock market significantly matters to their performance and return.
S&P 500 10 Year P/E Ratio & Buffett Indicator Standard Deviation from Long Term Trend

Bloomberg, Rand Group and Advisor Perspectives Valuation Metrics

Our MacroVex Capital, S&P 500 fair value estimate model currently indicates fair value for 2025 earnings of $272 and 2026 earnings of $312 between 4,155 and 4,920, down -44% and -34% from the S&P 500, 2026 June closing price of 7,499.
We believe throughout the rest of 2026 there will be major fiscal and monetary changes that provide great investment opportunities. Our recommendation is to position portfolios to endure a recession, in a defensive manor, risk off, cash, T-bills, money market funds, short to mid-term 1-10 year U.S. treasury bonds and 10-30 year U.S. treasury bonds at positive carry, 10-year minus 2-year yield curve re-steepening, 10-year minus 3-month yield curve re-steepening, and select low duration U.S. equities.
Getting paid to wait for growth assets to be priced at discounts, while being positioned to benefit from bond price appreciation as interest rates decline from downward economic pressure, continues to be a profitable and rewarding strategy. We remain patient and focused on managing risk through 2026.
Disclosure: Investing involves risk, including the possible loss of principal and fluctuation of value. Past performance is no guarantee of future results. This letter is not intended to be relied upon as forecast, research or investment advice, and is not a recommendation, offer or solicitation to buy or sell any securities or to adopt any investment strategy. The opinions expressed are as of the date noted and may change as subsequent conditions vary. The information and opinions contained in this letter are derived from proprietary and nonproprietary sources deemed by Macrovex Capital, LLC to be reliable. The letter may contain “forward-looking” information that is not purely historical in nature. Such information may include, among other things, projection, and forecasts. There is no guarantee that any forecast made will materialize. Reliance upon the information in this letter is at the sole discretion of the reader. Please consult with a Macrovex Capital, LLC financial advisor to ensure that any contemplated transaction in any securities or investment strategy aligns with your overall investment goals, objectives, and tolerance for risk. Additional information about Macrovex Capital, LLC is available in its current disclosure documents, Form ADV and Form ADV Part 2A Brochure, which are accessible online via the SEC’s investment Adviser Public Disclosure (IAPD) database at www.adviserinfo.sec.gov, using CRD #300692. Macrovex Capital, LLC is neither an attorney nor an accountant, and no portion of this content should be interpreted as legal, accounting or tax advice


Comments